Share
What is a Power BI Datamart?
And why you should include them in your solution
A blog by ChatGPT with a little help and guidance.

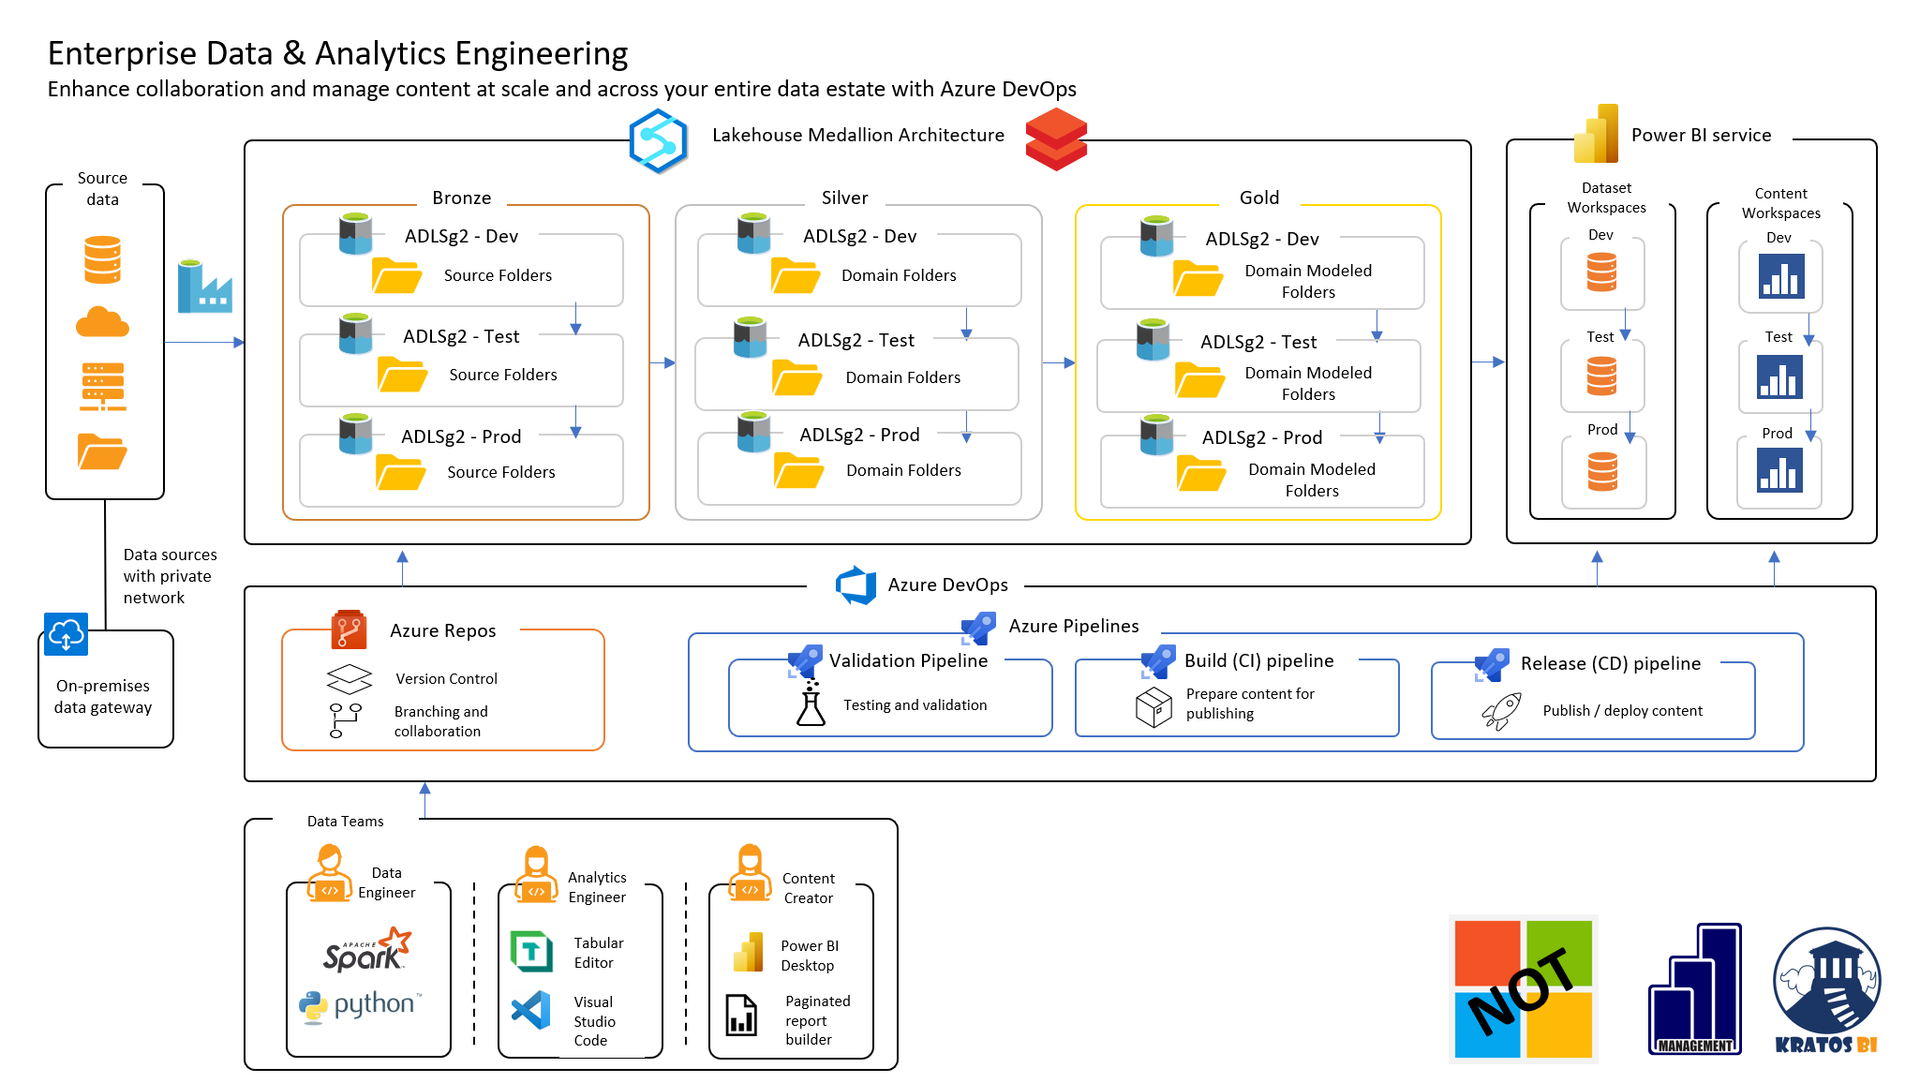
In a data architecture, PowerBI datamarts are usually positioned downstream from other components, such as data warehouses and data lakes. This means data is typically loaded into a datamart after it has been processed and transformed in some way.

For example, data from transactional databases, log files, and web analytics tools may be extracted, transformed, and loaded into a data lake. The data may be further transformed and organized into a data warehouse. Finally, the data may be loaded into a PowerBI datamart for fast querying and analysis.

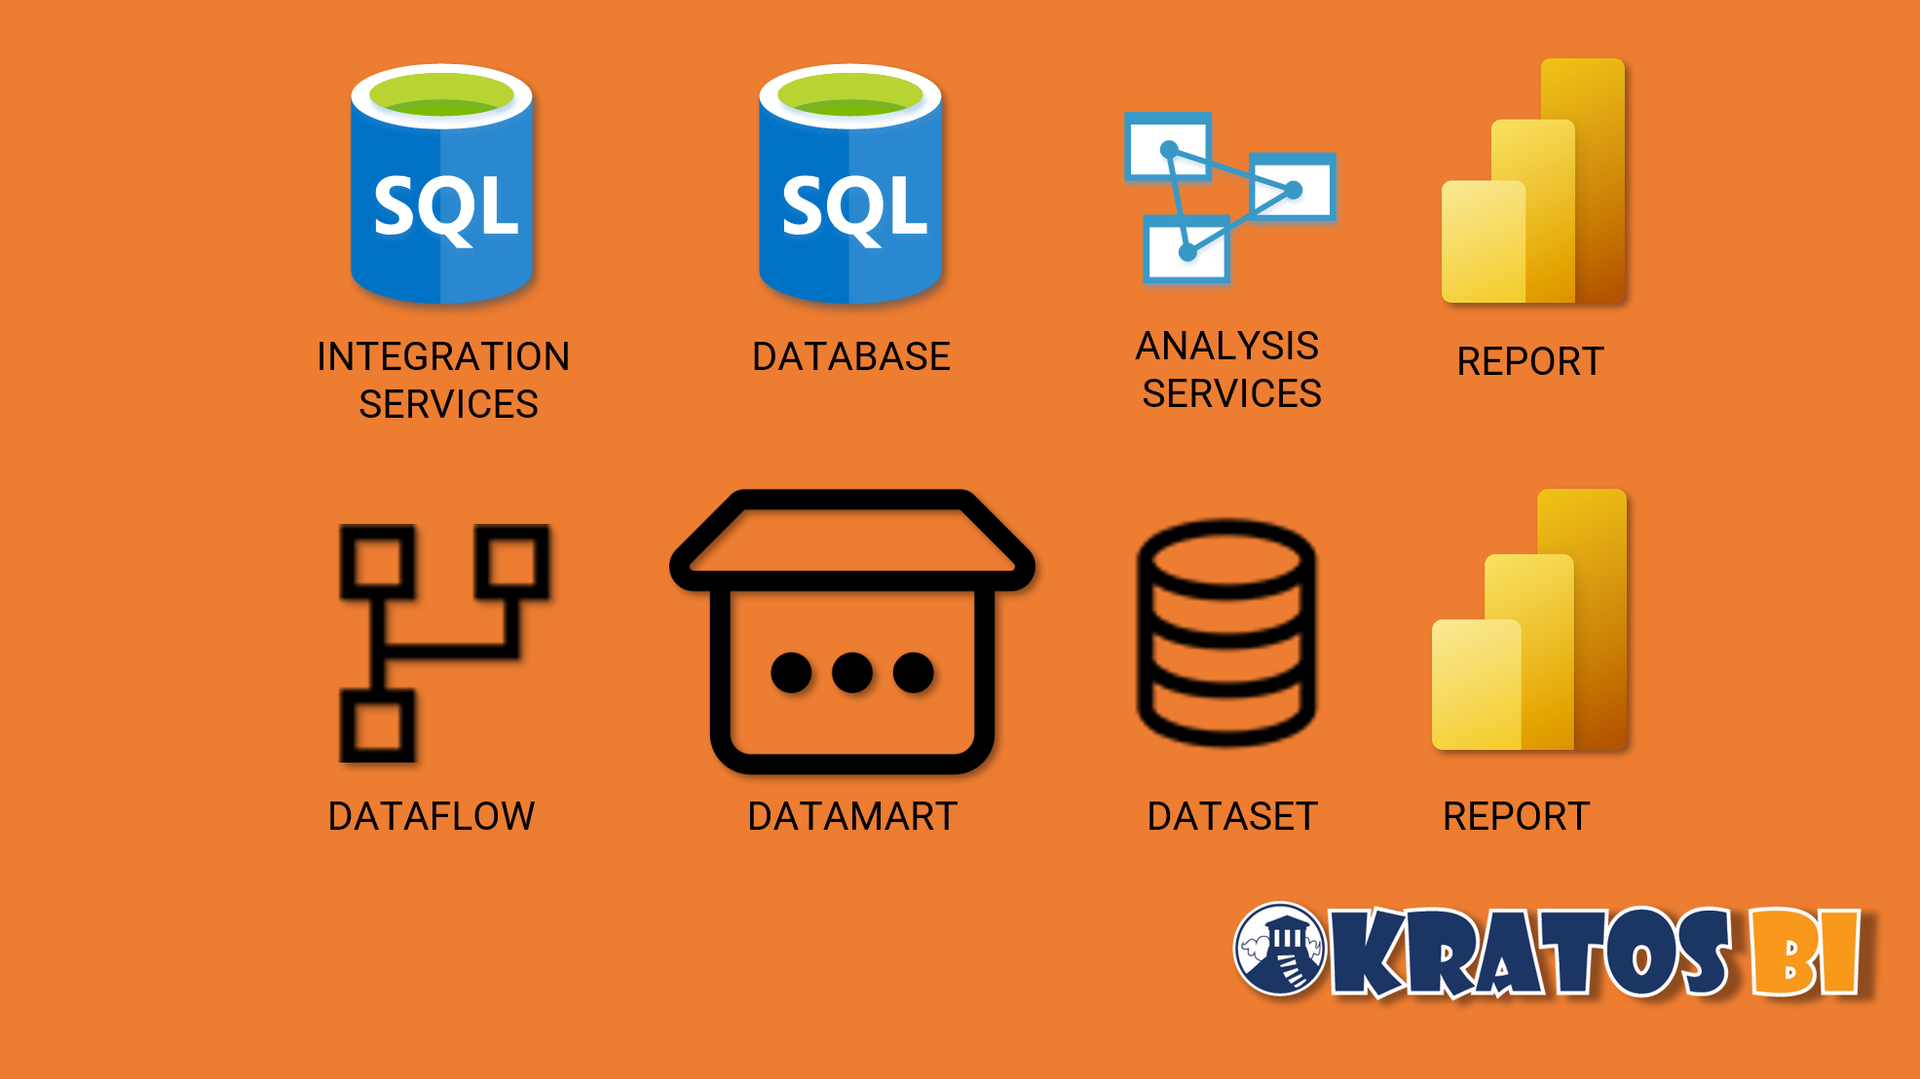
The online Power BI Architecture has many similarities to the classic Microsoft Business Intelligence (MSBI) toolkit.
SQL Server Integration Services (SSIS) >>> has become >>> Power BI Dataflows
SQL Server Database >>> has become >>> Power BI Datamarts
SQL Server Analysis Services (SSAS) >>> has become >>> Power BI Datasets
SQL Server Report Server (SSRS) >>> has become >>> Power BI Paginated Reports

New Paragraph

In Power BI, a dataflow is a reusable data pipeline that you can use to extract, transform, and load data into the Power BI service. Dataflows allow you to centralize your data preparation logic, so you can easily share your data with others and reuse it in multiple reports and dashboards.
A dataflow consists of one or more entities defined by a query specifying how to extract and transform data from a source. You can create dataflows by connecting to various sources and using the Power Query language to shape and transform the data. You can then use the data in the dataflow to create reports and dashboards in the Power BI service.

A PowerBI datamart is a specialized database that queries and analyzes data quickly. It is typically used to store large amounts of data from various sources, such as transactional databases, log files, and web analytics tools downstream from the data warehouse.
The primary benefit of using a PowerBI datamart is the ability to quickly and easily access and analyze large amounts of data. With a datamart, you can easily create interactive dashboards and reports that visualize your data in meaningful ways. This can help you identify trends, patterns, and insights that can inform business decisions and strategies.
Another advantage of PowerBI datamarts is their flexibility. You can easily connect to various data sources, such as SQL databases, Excel spreadsheets, and CSV files. This makes it easy to bring all of your data together in one place and analyze it in a unified way.

In Power BI, a dataset is a collection of data imported from one or more sources. It can include tables, columns, and measures (calculations) created from the data. You can use datasets to create visualizations, reports, and dashboards in Power BI.
You can create a dataset by connecting to a data source and importing data or by using the data modeling features in Power BI to shape and transform the data. Once the dataset is created, you can use it as the basis for creating visualizations and reports in Power BI.

Overall, a PowerBI datamart is a powerful tool for storing, querying and analyzing large amounts of data. Whether you're a small business owner looking to gain insights from your sales data, or a large enterprise looking to optimize your operations, a PowerBI datamart can help you make better, data-driven decisions.

CHRIS WAGNER, MBA MVP
Analytics Architect, Mentor, Leader, and Visionary


