Share
Easily Build Great User Experiences In Power BI
Power BI Seed Makes Navigation Easy

It's nearly effortless to overwhelm people with data, visuals, grids, and AI. Creating a collective experience for users to navigate your Power BI report quickly helps with the adoption of the report. A great UX/UI drives the impact of reports on the business.
Seed??? What the heck is a Seed?
Many of you may refer to this as a template file for Power BI development. You would be VERY wrong with that.
I prefer the term Seed because these are standards that you can grow your reports from. Seeds are highly functional entities that can be used by us 'Data Farmers' to grow analytical platforms quickly and easily.
Thus "Seeds".
Power BI Navigation Seed

The Kratos BI Power BI Seed is used to build out Power BI reports business partners can easily navigate. With these resources, you can quickly and rapidly build out sophisticated and powerful dashboards without having to spend a great deal of time on formatting, design, and training.
Navigation

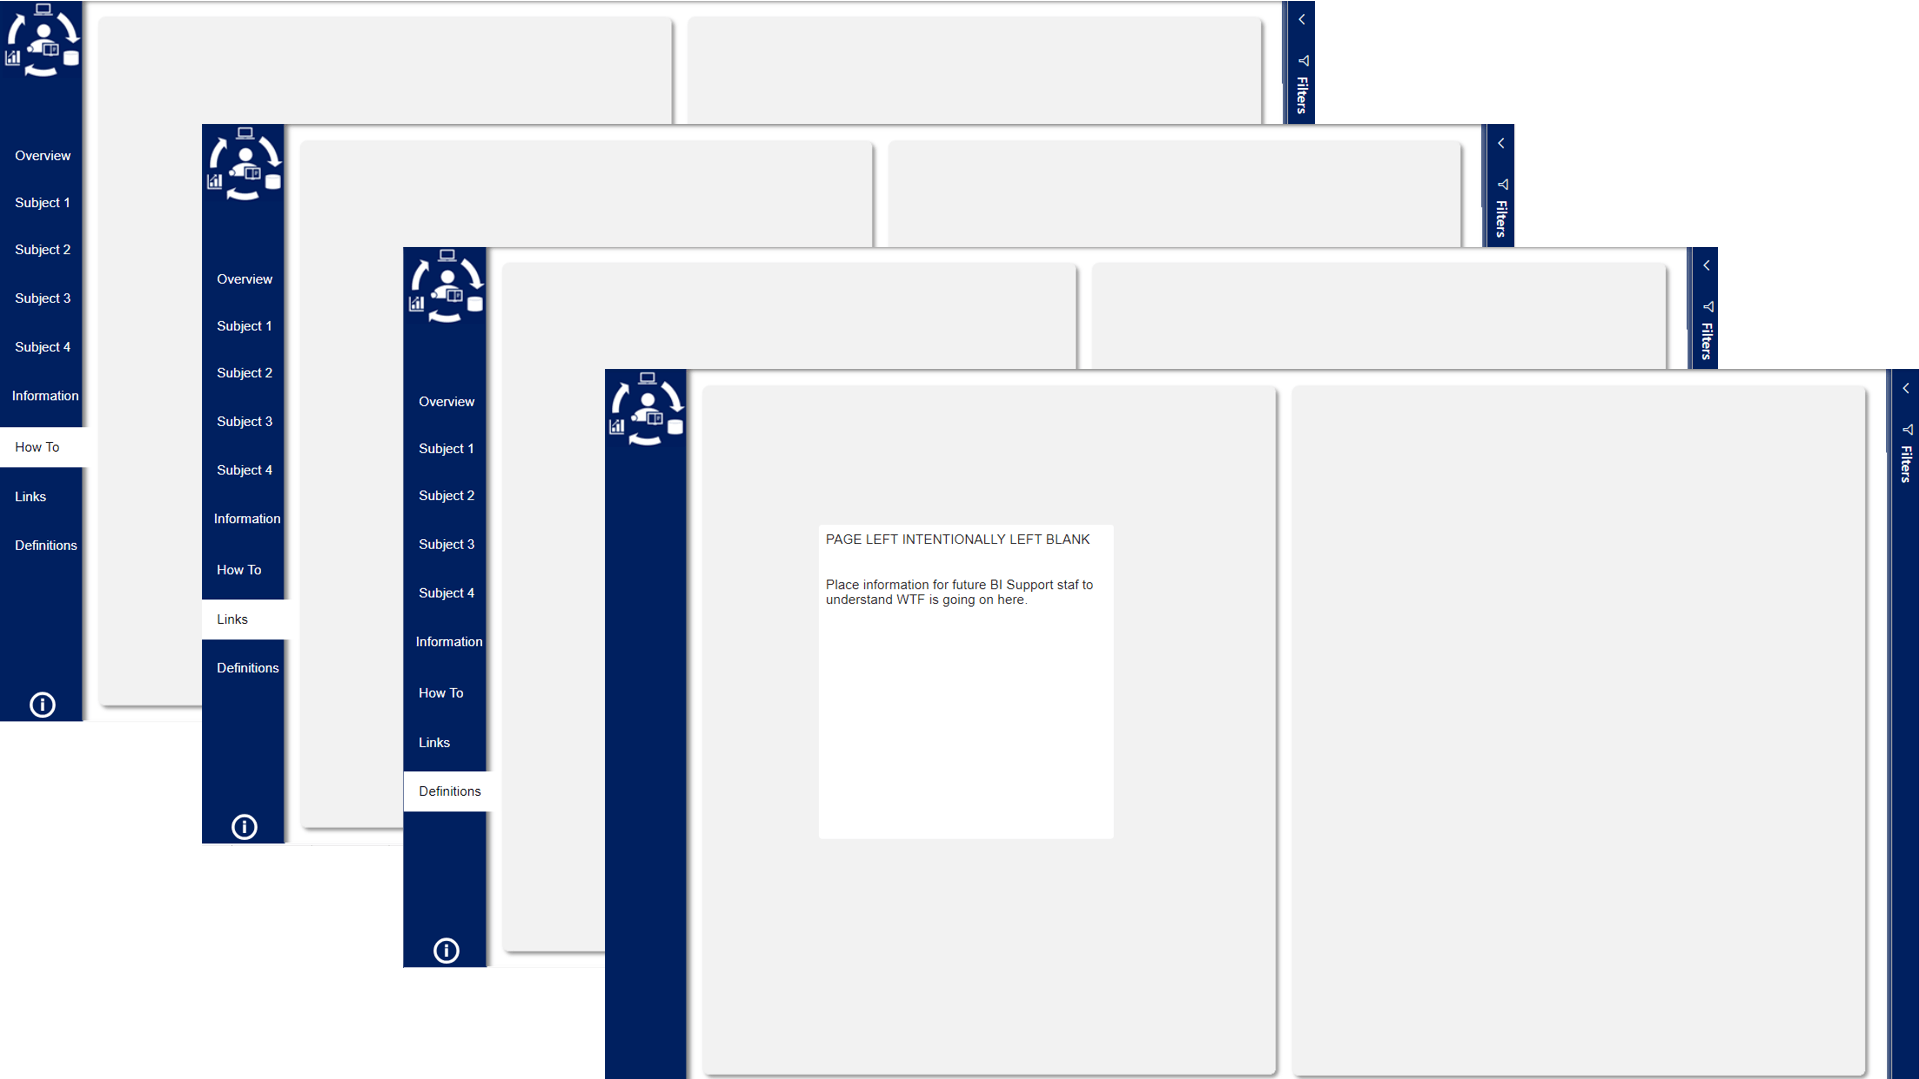
The side navigation creates a single place for users to navigate between subjects within your Power BI experience. Breaking out by different subjects simplifies both the experience for users who consume the data AND makes Power BI development much easier to use.
Subjects
- Overview - The Overview tab should contain a mixture of the subjects focusing one key metrics for each
- Subject 1-4 - The Subjects tabs walk through a deeper dive into any of the specific subjects
- Information - Use the Information tab to house meta-data about the Power BI report
- How To - The How To tab should contain material that helps users understand how they can work with the report
- Links - Include links to standard applications, SharePoint sites, or report documentation.
- Definitions - Define the data in the report in terms that users are familiar with and can easily understand
These subjects navigate to different tabs allowing you to use different backgrounds, structures, and navigation. Good navigation also helps break out the selected items and groupings that you are working with on a given tab.
Deep Dive Navigation
Each subject has a standard navigation pattern allowing BI Engineers to tell a more in-depth story without having to have hundreds of tabs. The standard navigation makes navigating any given subject much more natural to report consumers.
Subject Breakouts
- Summary - Key metrics and visuals that indicate performance for a subject
- Breakout 1-4 - Breakouts on a subject that enable users to dive deeper into each subject
- Key Influencers - The Key Influencers visual focused upon the subject to enable root cause analysis
- Decomposition - The Decomposition Tree visual providing another means of understanding top or bottom performers
- Q&A - A commonplace for users to ask their questions of the data. *
* Make sure you have filled out the proper metadata to enable Q&A and create sample questions that users can use.
Bookmarks - Not just for Harry Potter any more

The key to navigation in the Power BI Seed is the usage of Bookmarksand the ability to Show / Hide content. All of the Bookmarks and Items have common names that make finding items and making selections easy to modify for each user.
Tab Selection Bookmarks match the name of the Tab.
Example: Overview Tab, Subject 1 Tab, Information Tab, etc
Bookmarks
Each Tab has a set of bookmarks associated with them.
- xxxx Tab - The landing page for the Tab
- xxxx Info - The bookmark for overlays of the Tab for instructions and guidance for users
- xxxx Breakout 1-4 - The bookmark for each of the sub-tabs that will contain visuals
- xxxx Key Influencers - The bookmark for the Key Influencers navigation
- xxxx Decomp - The bookmark for the Decomposition Tree navigation
- xxxx Q&A - The bookmark for the Q&A navigation
Buttons
There are standard buttons that have the name of each Tab used to navigate between each page.
There are also sets of two buttons that help you navigate within a single tab. Each button will have a regular and 'light' version. These two buttons overlay each other entirely (Align left, Align top) and switch between show/hide when different bookmarks are selected.
NOTE - When you change the names of the Breakout buttons, make sure that you change the name on the button text for both versions of the button.
ACK - Don't DELETE that comment just yet!
Each Tab and each internal navigation has a text box comment that is used to build in your hide/show functionality quickly.
Leave that comment until you follow these steps.
- Add visuals to the individual navigation
- Group the visuals with the text box comment
- Make sure the group follows the Hide / Show for the text box
- Delete the text box
These comment boxes make adding visuals to each navigation much easier to get right.
Help Future You Save Time

Each report needs to include an Information tab that provides users with standard information about the report.
Report Details
The first section of each report should contain all of the critical pieces of information necessary for users to communicate with you about the issues that they are having with the report. Train your users to always provide this information along with screenshots of the issue to significantly shorten the time it takes you to troubleshoot and resolve any issues.
Data Refreshed Information
The next section answers the question every user is going to be asking about analytical data. When was this data last updated, and how up to date is this data? Just because a report updates today does not mean that the information is available through today. Often the report data is through the last day or month-end. Having a single place for users to go to identify the date the data refreshed helps users understand the data.
House Keeping Content

The last four tabs address some housekeeping tasks that many engineers can overlook, but are often really important for users if they are going to understand your report.
How To
Provide users with a guide for how they can best use your Power BI report. Include screenshots, write-ups, and even links to other applications or videos on how other users are using this report to impact business success.
Links
This Tab includes links to Team or SharePoint sites, applications, or web links that help users who are consuming your dashboard.
Definition
Include clear write-ups using the business language for the measures and attributes in your report. Business definitions help users understand what they are looking at or how this works without having to contact you directly. Save yourself some time.
Please write it down when you are building the report.
Power BI Admin
Be kind to future you, or the developers who come along well after you go crazy dealing with Business Intelligence and take some time to add comments around what it takes to run or build this Power BI report. Identify any known issues or things that do not work the way it should, or outstanding items.
This Tab is really for the BI Engineer. Use it.
I have spoken.
Grow Your Own Seed

The Kratos BI Power BI Seed comes with the PBIX file that includes all of the bookmarks, navigation, and embedded images highlighted in this article. It also comes with the background images used in the PBIX file as well as the PowerPoint used to generate the background images.
Your first step in using this Seed, after you play with it a bit, should be to modify the PowerPoint to switch over to your company's standard colors and logo, generate the background images, and then save them into the PBIX file for your internal Seed.
Kratos BI Power BI Seed + Kratos BI Excel Seed
Both the Kratos BI Power BI Seed and the Kratos BI Excel Seed are available on the Get Started with Power BI page on kratosbi.com. These are all free of charge, and I have created out of my love for data analytics and Power BI.
If you like this content, I highly recommend checking out Alluring Analyticsauthored by Chris Hamill. He has several other examples of this type of navigation that you can leverage.
I hope you enjoy these and find them useful for your Power BI content creation.
CMW

CHRIS WAGNER, MBA MVP
Analytics Architect, Mentor, Leader, and Visionary


