DATA GOD OF THE SEA


Reid Havens

HavensConsulting.net

Reid is the founder of Havens Consulting Inc. and is a Microsoft Most Valued Professional (MVP). He has an extensive background in technology and organizational management, and has obtained a Master's Degree in Organizational Development and Business Analytics. He has experience as a consultant working with many Fortune 50, 100, and 500 companies. Additionally, he teaches Business Intelligence, reporting, and data visualization courses at the University of Washington and other universities.

DATA GOD QUALIFICATIONS

Reid has successfully sailed the dangerous seas of data analytics for the last decade. Helming the ship at Haven's Consulting, Reid has designed solutions, training materials and YouTube videos that have helped people from sea to sea.

To reach a port, we must sail - sail, not tie at anchor - sail, not drift..
Franklin D. Roosevelt

Reid is an avid content developer. He has authored numerous videos and articles on multiple video platforms and blog sites. He has also developed multiple training curriculum that have been delivered to numerous companies around the world. In addition to corporate training, he has also developed college level curriculum for the University of Washington and other universities.
TOP 4 RECOMMENDED VIDEOS FROM REID

Creating a Slicer Pop Out Window

Learn how to leverage bookmark buttons and a bit of design magic to create a fully customized bookmark pop-out window. 

Custom KPI Card

Learn how to combine two visuals to create a KPI card with a value, conditionally formatted status bar, and details label at the bottom. 

Creating a MTD/QTD/YTD Time Intelligence Slicer in Power BI

Part one of four in a series. Learn how to leverage relationships and DAX calculated tables to create a time intelligence slicer. 

Splitting a Power BI (PBIX) File into a Dataset and Lean Report File

Learn how to take an existing import mode Power BI Desktop (PBIX) file and split it into two files.

AppSource Content

Google Analytics Report

Provides a detailed report built off the last six-months of your Google Analytics data. Allowing for a deep dive analysis on daily page views with forecasting and adjustable rolling average, month-over-month traffic gain or loss, top pages visited, traffic source trends over time, and more.


Once you log in with credentials you'll be prompted to enter your Google Analytics View ID. This will replace the sample data with the last six months of your sites data. Depending on the size of your data, the initial load may take some time due to the speed of the Google Analytics API. On average, it can load about 35,000 rows a minute.


You can also purchase a refresh subscription for this AppSource online-only version for $9.99 per month. The refresh subscription will give you access to all historical data. With either online versions the report layout can be edited, but no data model changes can be made.


Lastly you can purchase the downloadable PBIX file which gives you access to the report, tabular data model, and back-end logic. Details on either the subscription or downloadable PBIX version, plus other Power BI reports and files can be found at our Files Store page.


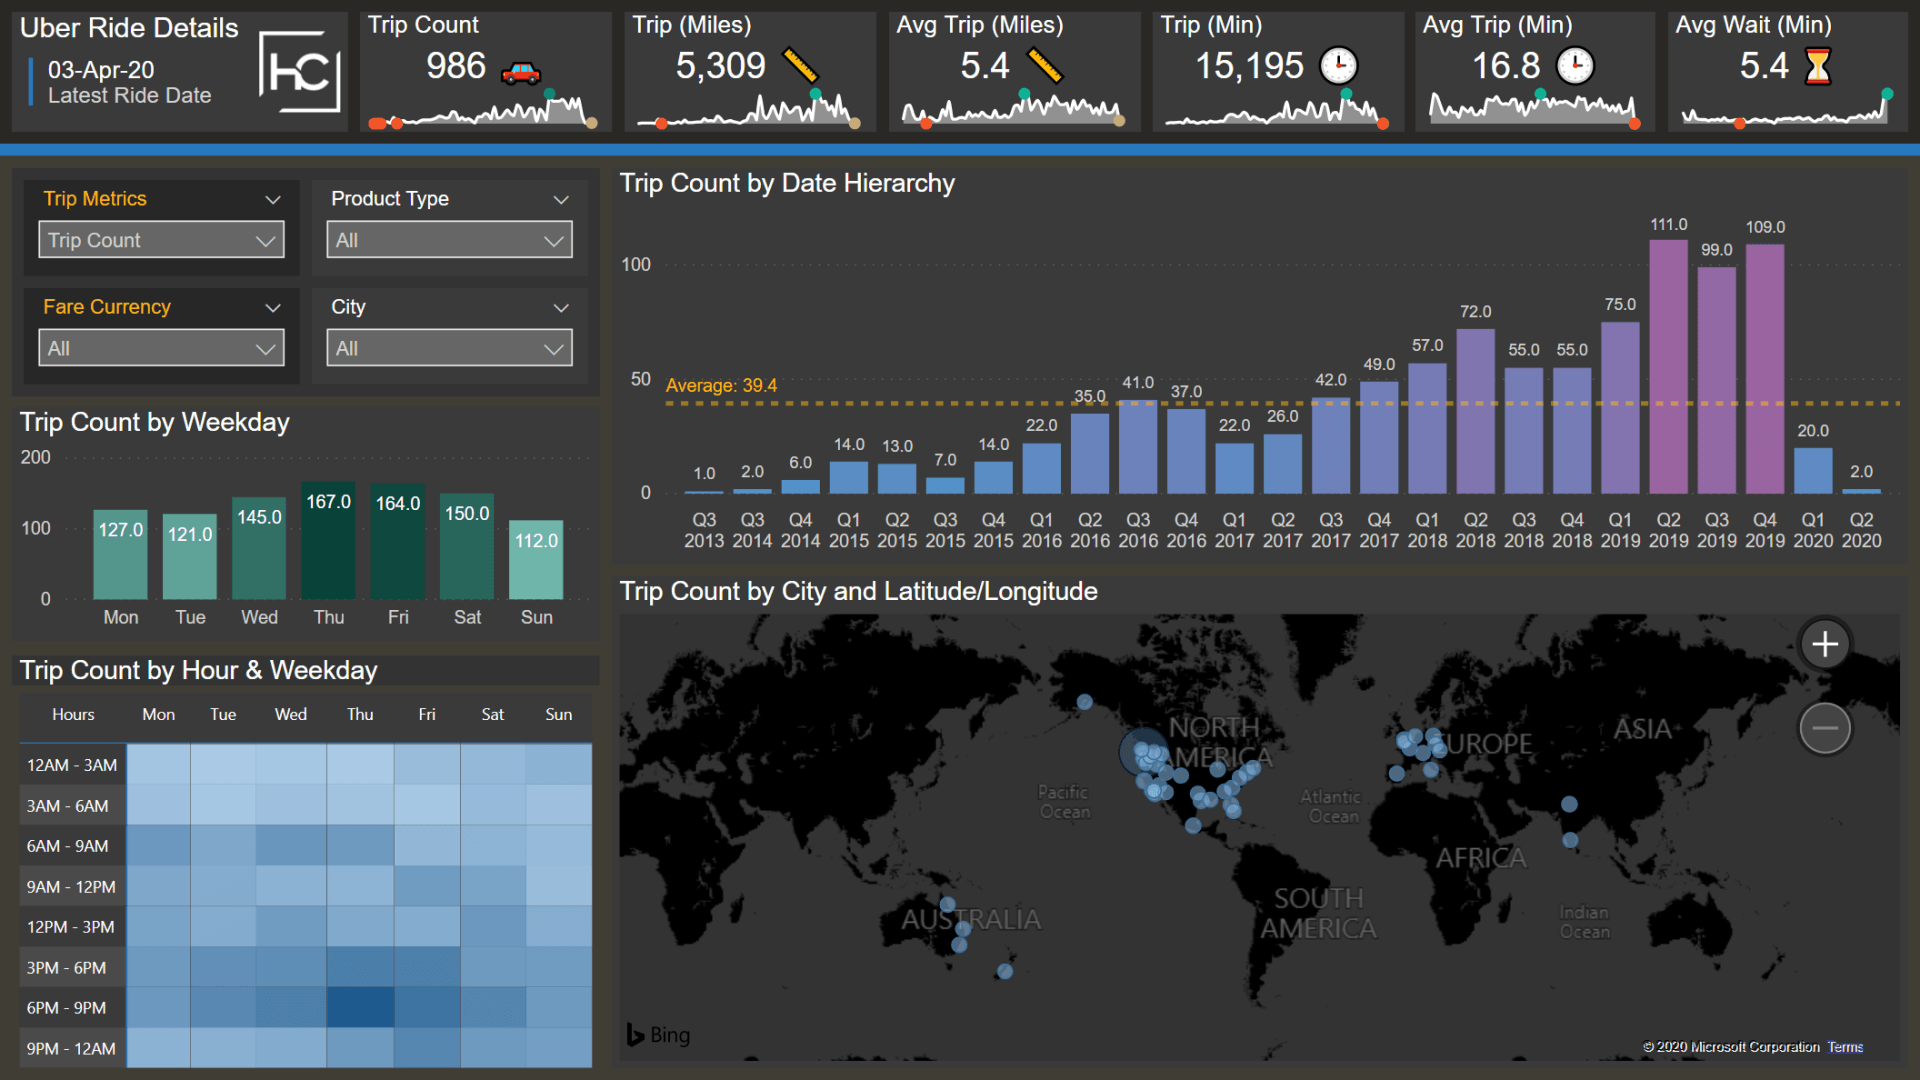
Uber User Data Report

Provides a detailed report built off the last twelve-months of your downloaded Uber user data. Allowing for a detailed analysis of your Uber rides and Uber eats deliveries. The report includes two pages of various visuals focused on your user data: such as date and time information, geo location details, and dynamic metric selection for most visuals.


To use this report you must first download the user data from your Uber account. It can take up to 30 days for them to export your data, but commonly is within a week.


You can also purchase the downloadable PBIX file which gives you access to all historical data, the report, tabular data model, and back-end logic. This version will not require SharePoint access. Details on this and other Power BI reports and files can be found at our Files Store page.

Spotify User Data Report

Provides a detailed report built off the last twelve-months of your downloaded Spotify user data. Allowing for a detailed analysis of your streaming history, saved album information, and created playlist details. The report includes two pages of various visuals focused on your user data, plus hyperlinks to track, artist, and album info on Spotify.


To use this report you must first download the user data from your Spotify account. It can take up to 30 days for them to export your data, but commonly is within a week.


You can also purchase the downloadable PBIX file which gives you access to all historical data, the report, tabular data model, and back-end logic. This version will not require SharePoint access. Details on this and other Power BI reports and files can be found at our Files Store page.

YouTube Analytics Report

Provides a detailed report built off YouTube Analytics data. Allowing for a deep dive analysis on video views, hours watched, likes, dislikes, shares, and comments. Advanced Metrics such as forecasting, adjustable rolling average, month-over-month traffic gain/loss, performance since publish date, top ranked videos, and more. 


This report utilizes a custom YouTube connector built by Miguel Escobar (Powered Solutions). AppSource currently does not support custom connectors, so this report only includes demo data. 


You can also purchase the downloadable PBIX file which gives you access to all historical data, the report, tabular data model, and back-end logic. Details on this and other Power BI reports and files can be found at our Files Store page.

DATA GOD FUN FACT


Reid presented over 24 times in 2019, and loves to talk about Power BI.

Shhh...

Reid really loves sailing. He co-owns a 28ft Catalina with a friend. When he is not talking Power BI, you can often find Reid out on the open sea sailing the waves.
Share by: