DATA GOD OF POETRY

Christian Borovac
DiscoverEI.com
Christian Borovac is a passionate data analyst, environmental engineer, graphic designer and registered drone pilot. Relatively new to the data analytics field, he has slotted in seamlessly to the fantastic community of Power BI users in Melbourne, Australia. Having teamed up with his wife (The Goddess of Nature and Beauty) to start DiscoverEI in April 2019, he is excited to keep learning from the best, and continuing to help people on their own Power BI journey.
DATA GOD QUALIFICATIONS
Christian weaves the Environment into Data Tales and Visual Stories that people read like a fantasy novel. He combines his three superpowers of Power BI, Graphic Design, and Environmental Engineering to visualize and communicate environmental problems to help us create a more sustainable future. Christian recently launched a Power BI Data Storytelling training course specifically designed to help others transform standard reports into engaging and intuitive stories.
Painting the picture of our environment is more than numbers and charts.Christian Borovac
Painting the picture of our environment is more than just numbers and charts. At DiscoverEI, we are passionate about using data analytics and visualizations to secure a more sustainable environment for tomorrow. We are a team of environmental engineers, data analysts, and computer animators, who combine these skills to share and communicate our environmental data story. Find out more about our team, what we stand for, and what sets us apart.
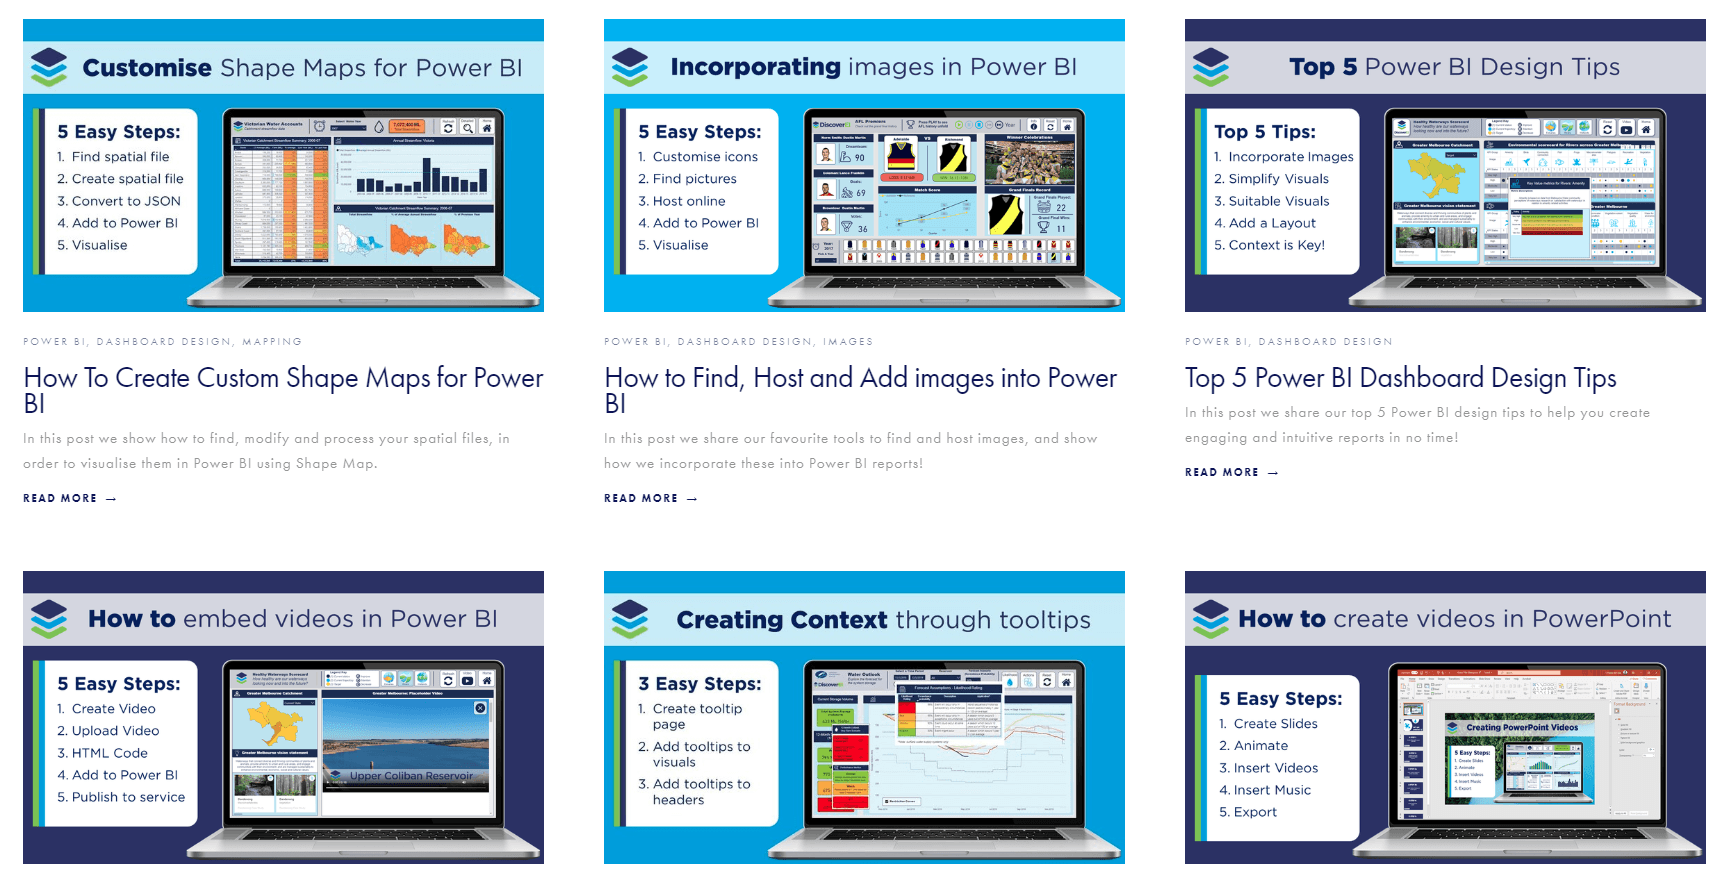
5 Steps to add Images to Power BI Reports
01
Customize Icons
Add custom icons to personalize
02
Find Pictures
Easily add photos to your collections from pexels.com
03
Host Online
Host images on imgbb.com to improve performance and access
04
Add to Power BI
Import URL Image information into Power BI dataset
05
Visualize
Add images into Power BI reports to better visualize and encapsulate data
DATA GOD FUN FACT
Christian is a passionate sportsman and loves combining this with data! He decided to cycle 3,000km across Europe for his honeymoon and loves making sports’ dashboards for fun!
Take a look at the AFL dashboard on the Data Stories Gallery
if you want to see an example of how to combine data with sport!


